NEW
Proxify is bringing transparency to tech team performance based on research conducted at Stanford. An industry first, built for engineering leaders.
Learn more
Insights
Nurturing
Jun 26, 2025 · 15 min read
Metrics that actually move the needle for CTOs
After working on interviewing more than 50 people in leadership positions as the research team on Proxify’s Builders podcast, I noticed one topic popping up more often than others – metrics. From giants like Microsoft, to up-and-starting startups, tech leaders from all callibers struggle with finding the right metric to move the needle.
Stefanija Tenekedjieva Haans
Content Lead
Verified author

Table of Contents
- What successful CTOs suggest
- Kirill Groshkov, CTO at Natural Cycles
- Jonas Martinsson, CTO at Stravito
- Oliver Spragg, previously CTO at PlanA and Augmento
- Code review as a signal: Stanford University’s findings
- What the researchers did
- Why this matters for engineering leadership
- Strategic takeaway for CTOs
- The DORA findings
- Key metrics used
- Flow: A true signal of developer effectiveness
- Organizational performance: Where the boardroom cares
- Product performance: A lagging indicator
- Productivity: Scaling through individual efficiency
- Team performance: The invisible engine
- Find a developer
Modern engineering organizations are obsessed with metrics. Dashboards sprawl across big screens, cycling through deployment frequency, bug counts, lead times, and other fine-grained telemetry. But behind all that data, many CTOs still wrestle with a simple question: Are we actually getting better?
Here’s what CTOs suggest, and here is what research from Stanford University and Google Cloud’s DORA has proven to work.
What successful CTOs suggest
Boost your team
Proxify developers are a powerful extension of your team, consistently delivering expert solutions. With a proven track record across 500+ industries, our specialists integrate seamlessly into your projects, helping you fast-track your roadmap and drive lasting success.
Kirill Groshkov, CTO at Natural Cycles
Disclaimer: I am not a fan of software engineering metrics. Why? Because I almost don't know a single one that works! I like metrics everywhere else. For example, metrics derived from user behavior, which is often deterministic and predictable, are statistically analyzable given enough volume. Developers, though, often create something new that wasn't previously built or considered, so it's hard to put a number on it.
How to measure software quality?
The same piece of code can be seen very differently depending on the angle, context, and... the time. At the moment of writing/merging, it may look overly ambitious, too cautious, or stupidly optimistic. Two years later, the same code may not survive, or vice-versa - prove itself absolutely genius, not acknowledged enough at the moment of creation.
But if I'm to pick one metric – I like the ratio between a product's codebase size (total number of meaningful lines of code) and the amount of "product features" expressed over time.
Kirill Groshkov, CTO at Natural Cycles
I like to see a graph of a product's codebase growth over time. For example, we have an app codebase whose repository was created 8 years ago, and there's a graph of how its codebase has evolved over these 8 years. Usually, as a product driven by business requirements, it tends to grow (graph going up).
At the same time, there is an important "code consciousness and refactoring force" that's driving the graph down. It tracks how good the owning team is at gardening, removing obsolete/unnecessary features, outdated dependencies, technical debt, etc. It takes good effort and thinking to make the codebase healthy and efficient, bringing down the codebase size (proxy for complexity). These 2 forces - Product growth and Tech optimization–ideally complement and oppose each other on the graph (one pushing up, and one down).
There is no clearly defined expectation from this graph, as the Product growth path may be unpredictable, and different features on the codebase size non-comparable. But one thing that I'm keeping an eye on is if the growth/optimization looks sustainable and controllable, versus just going exponentially up. The latter may be a signal of imminent "complexity explosion", and may call for an intervention.
Jonas Martinsson, CTO at Stravito
As CTOs, we obsess over velocity and similar metrics, but I've found that measuring developer curiosity drives longer-term productivity gains than any traditional metric.
I think about curiosity through two dimensions: adoption breadth (how many engineers voluntarily explore new tools and resources) and knowledge depth (how deeply they engage and share their learnings). An engineer who experiments with a new tool and then runs a knowledge sharing session that enables others to operationalize that learning has many times the impact of someone who just tries something in isolation.
Jonas Martinsson, CTO at Stravito
The beauty of this metric is that it's both leading and compounding. Curious engineers don't just solve today's problems in a better way; they anticipate tomorrow's challenges and build the technical foundation to address them.
In our team, fostering curiosity has been more valuable than any hiring spree. It transforms good engineers into force multipliers who level up the entire organization.
Engineers with high curiosity consistently deliver more innovative solutions, identify technical debt proactively, and mentor others more effectively.
Pro tip: Make curiosity visible and celebrated. We highlight learning initiatives in all-hands meetings and during offsites, signaling that intellectual growth is as valued as shipping features.
Oliver Spragg, previously CTO at PlanA and Augmento
My experience with metrics has been mixed. I’ve used them to quickly surface issues and track progress. But I’ve also put metrics in place that created overhead, and in some cases, resulted in bad or sometimes unexpected outcomes.
A key learning for me is that metrics work best in the context of a specific problem or challenge. Larger challenges are also often seen or felt by stakeholders, and metrics are a great way to create transparency for stakeholders and leadership.
Oliver Spragg, previously CTO at PlanA and Augmento
In my experience, metrics haven’t worked so well to measure performance on an ongoing basis, especially in a team setting. One exception is tracking health metrics to flag issues, but I generally interpret these differently from improvement metrics.
To give an example where metrics have worked well: during a migration to a new data platform we saw a dramatic increase in reported bugs. This started to become a potential issue for customers, and we launched an initiative to rapidly increase our end-to-end coverage to address the problem.
Rather than tracking the automated end-to-end test coverage or the number of bugs caught in production, we tracked the number of bugs caught in our automated end-to-end tests / the total number of bugs. This is more widely known as the Automated Defect Detection Rate (ADDR).
This gave us a normalised view of the effectiveness of the initiative, and a lagging indicator of progress on the real issue (customer-facing bugs), not just activity (test coverage). It was also simple to track from day one.
This isn’t to say everyone should track ADDR. Rather it’s an example of using metrics as a tool to track progress and reduce cognitive load for leadership on a specific problem.
Code review as a signal: Stanford University’s findings
The idea that “not all code is equal” has always been understood anecdotally in engineering orgs. But until recently, the impact of code review complexity or hidden developer effort has been hard to measure in a consistent, actionable way. A 2024 research paper named Predicting expert evaluations in software code reviews (Denisov-Blanch et al., at Stanford University) offers a new angle: using machine learning to simulate expert judgment across thousands of pull requests.
Why should CTOs care? Because the study proposes measurable proxies for productivity and friction—without relying on output volume or gut feel.
What the researchers did
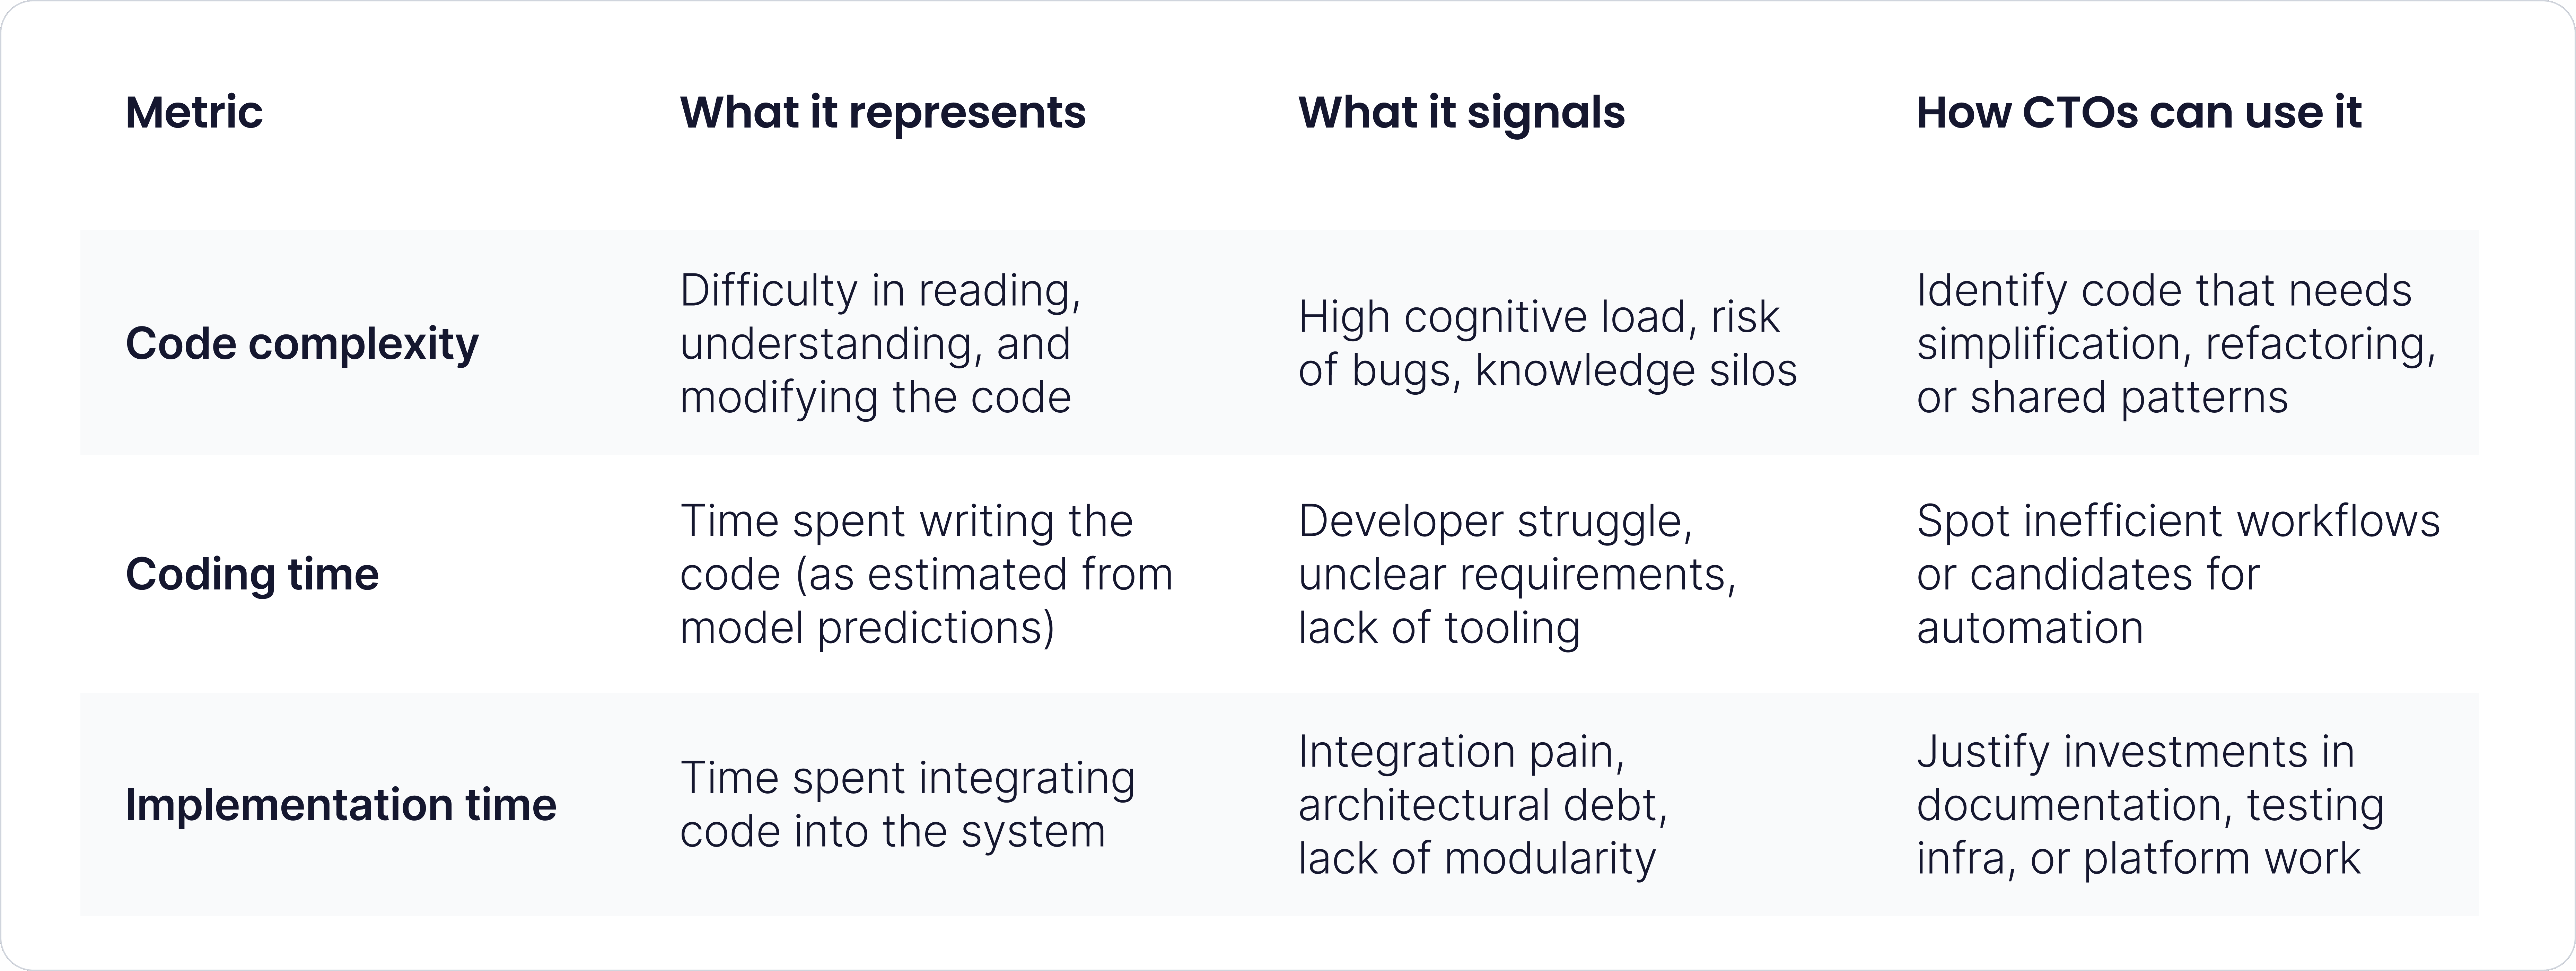
The study uses a large dataset of code review comments and associated metadata to train ML models that predict how expert engineers rate a given pull request along three dimensions:
- Code complexity (how hard the code is to read, understand, or modify)
- Coding time (how long it likely took to write the code)
- Implementation time (how long the developer spent integrating the change into the existing system)
These dimensions capture not just what was built, but how hard it was to build it. This moves us beyond traditional productivity metrics (like commit count or cycle time) and toward evaluating engineering effort more holistically.
Why this matters for engineering leadership
CTOs often face a dual challenge: on one hand, justify investments in tooling and process changes to the business. On the other hand, surface bottlenecks and cognitive overload that aren't visible on Jira boards. This paper gives us a data-driven way to do both.
For example, high code complexity scores might suggest the need for:
- Stronger architectural guidance
- Pair programming or code walkthroughs
- Simplified patterns or internal libraries
High implementation time could indicate:
- Poorly documented or fragmented systems
- Inadequate onboarding or context sharing
- Broken modular boundaries
Rather than punishing teams for taking longer, these insights help CTOs identify where to invest to reduce long-term cognitive load and rework.
Strategic takeaway for CTOs
Treat review metadata as a strategic lens. Tools that analyze pull request metadata (e.g. review duration, change size, comment count) already exist. Augmenting this with metrics like predicted complexity or estimated coding time could make your delivery data far more meaningful.
Benchmark effort, not just throughput. Two teams closing the same number of PRs may be doing radically different work. Understanding the effort involved helps avoid penalizing teams who are doing foundational or more complex work.
Frame these metrics as conversation starters, not scoreboards. Like DORA, the real power of these metrics lies in how they inform decisions, not how they rank teams. Use them in retrospectives, 1:1s, or postmortems to ask better questions: "What made this change so hard?" "How can we make it easier next time?"
Bottom line: The research gives us a glimpse of what smarter, context-aware metrics might look like in the near future. Not lines of code, not raw output—but signals of cognitive complexity and real effort.
For CTOs, that’s not just a better way to measure productivity—it’s a better way to lead.
The DORA findings
While the Stanford study gives us a powerful new lens to understand the effort behind engineering work, it still leaves a broader question open: how do these micro-signals scale up to influence team health, product outcomes, and business success? That’s where the DORA (Google Cloud’s DevOps Research and Assessment) research comes in. The DORA Accelerate State of DevOps report doesn’t just examine what engineers do—it connects engineering practices with organizational performance. In other words, it helps CTOs translate effort into impact.
The 2024 DORA Accelerate State of DevOps report offers a way out of this noise. It doesn’t promise magic KPIs or vanity dashboards. Instead, it shows which dimensions of engineering actually correlate with AI adoption and better organizational outcomes, from team collaboration to business profitability.
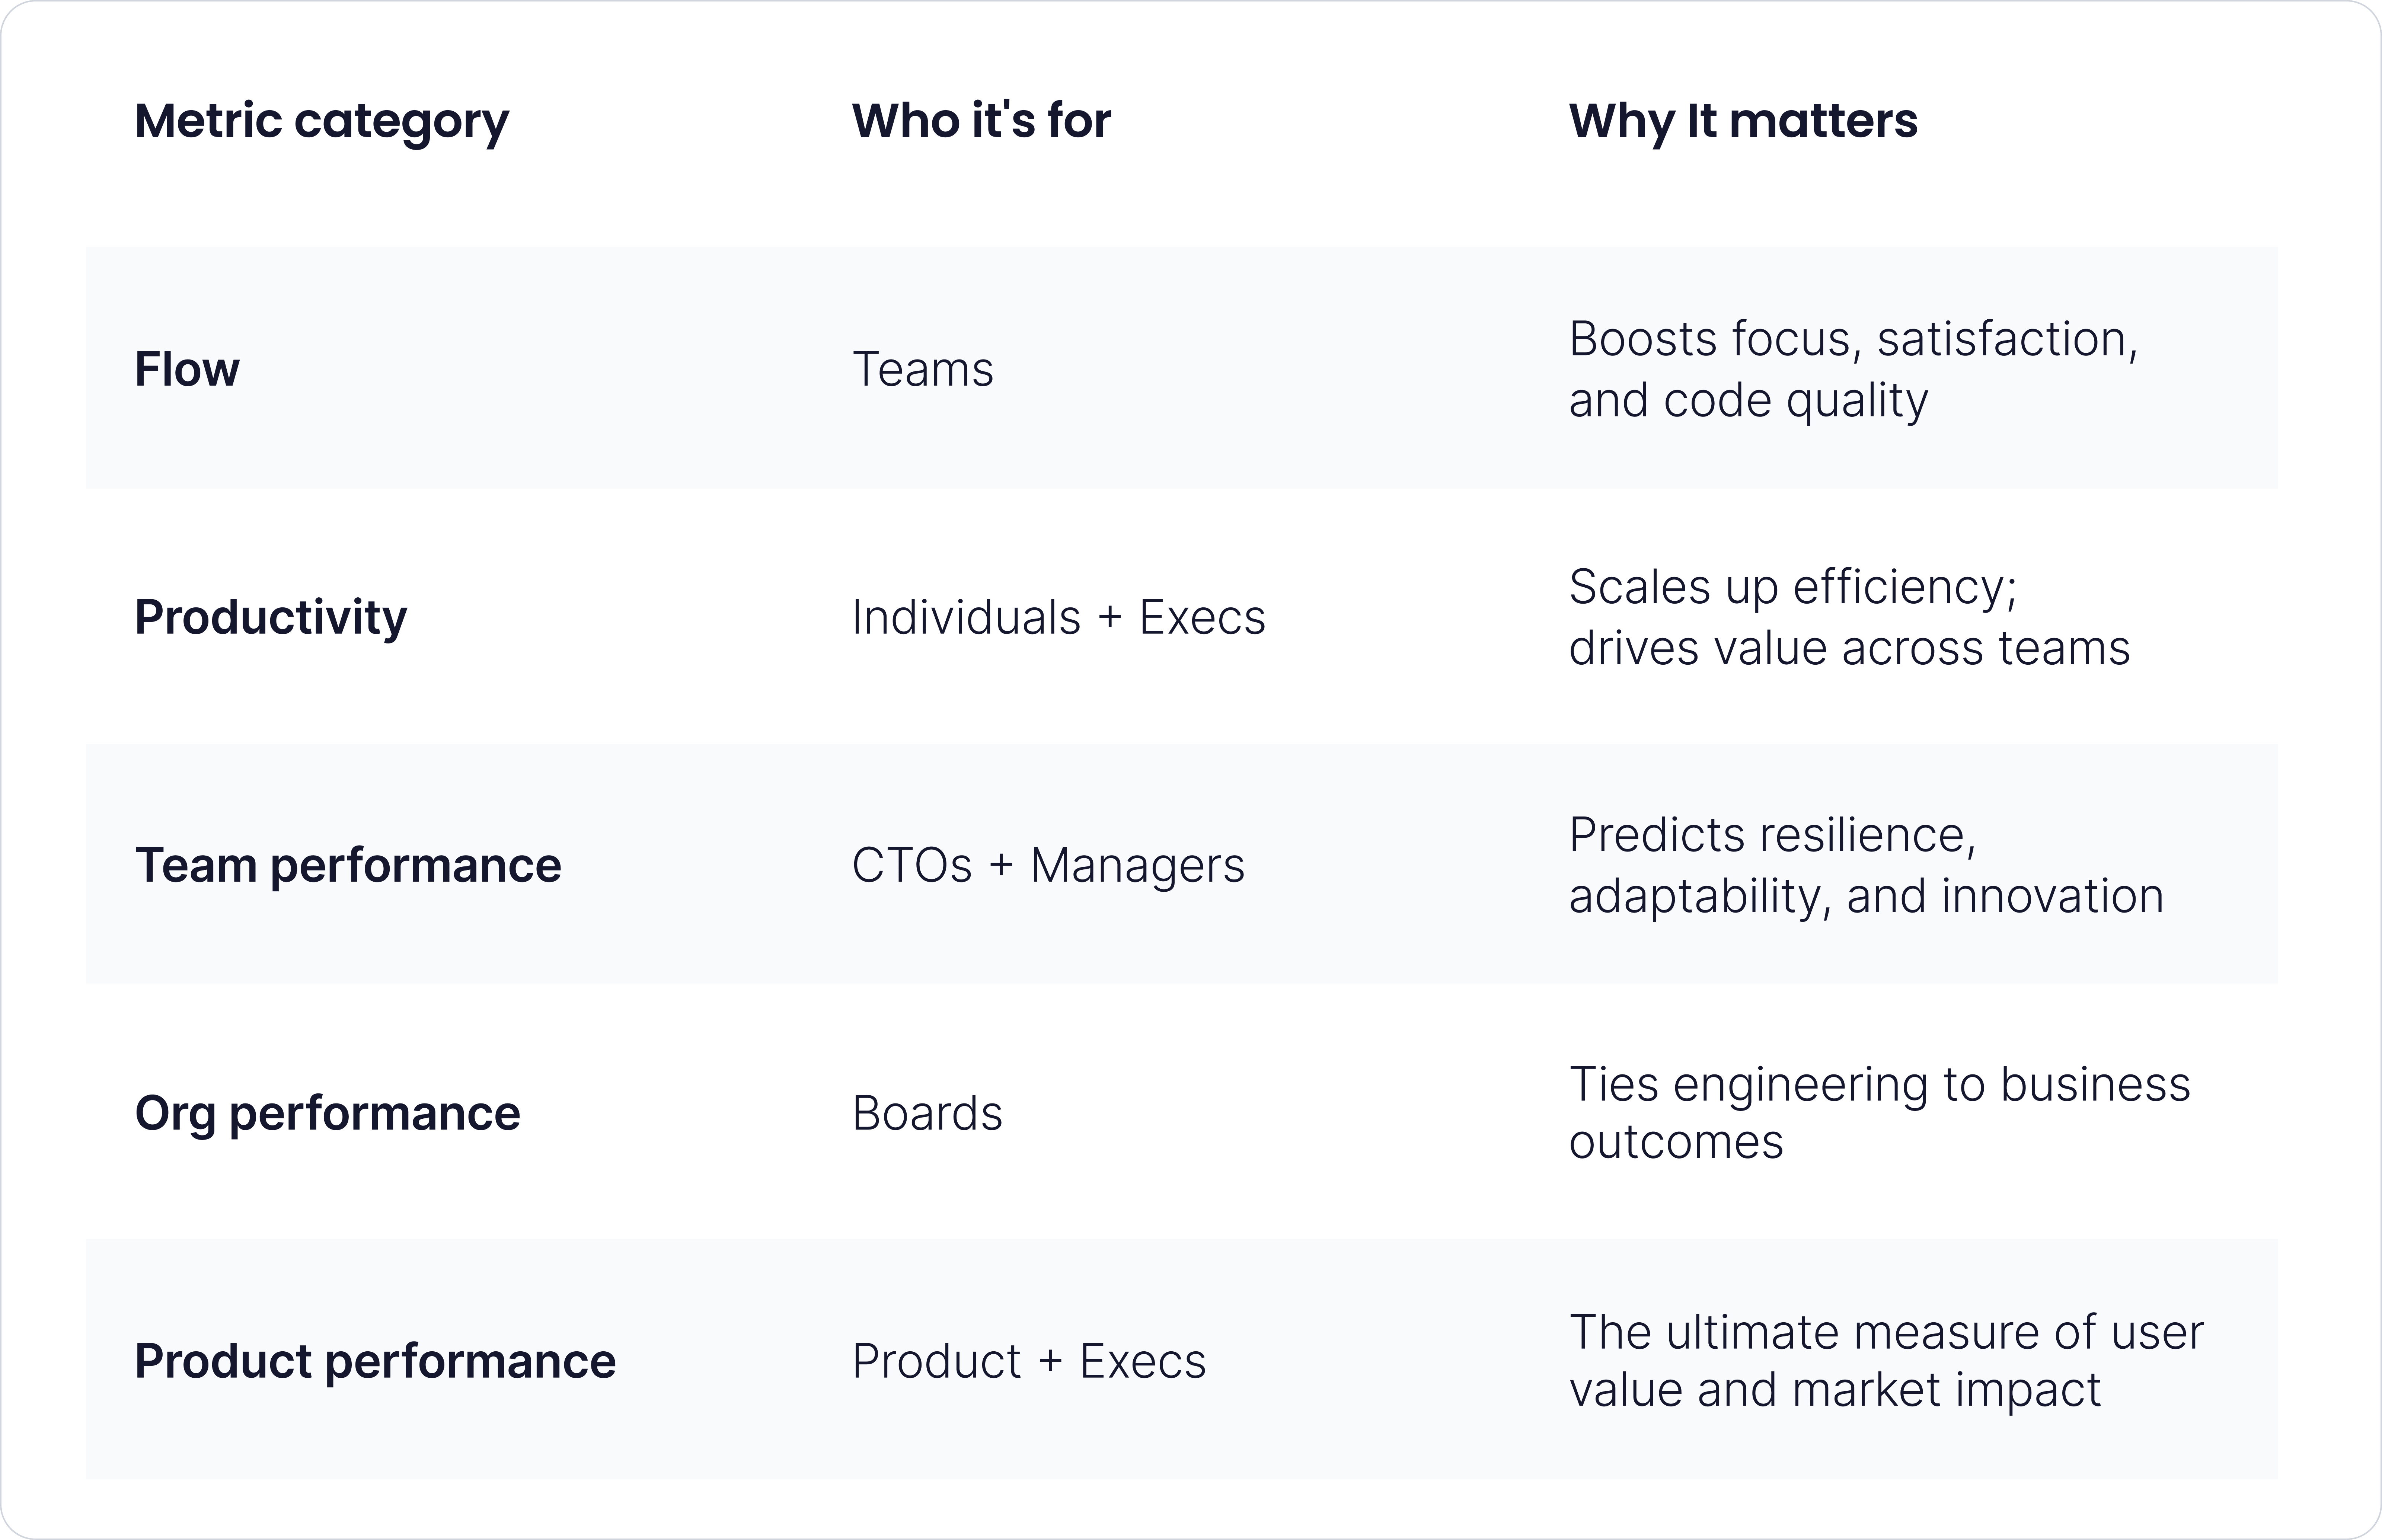
This article breaks down the report and focuses on five of the report’s most impactful themes:
- Flow
- Organizational performance
- Product performance
- Productivity
- Team performance
Each section highlights what the DORA data says, why it matters for engineering leadership, and how CTOs can use these insights to align teams, steer strategy, and speak fluently with both engineers and executives. Along the way, we will be offering some personal insights from tech leaders. Let’s break it down.
Key metrics used
At the core of the DORA framework are four foundational metrics that measure software delivery performance. These metrics aren’t just technical indicators—they’re proven predictors of organizational success when used in the right context.
Change lead time
The time it takes for a code commit or change to be successfully deployed to production. This reflects the efficiency of a team’s software delivery pipeline—from idea to impact. Shorter lead times generally indicate faster iteration and higher responsiveness to user needs or market shifts.
Deployment frequency
How often are application changes deployed to production?
Frequent deployments suggest a team is shipping in small, manageable batches—an indicator of healthy DevOps practices and high confidence in the release process.
Change fail rate
The percentage of deployments that result in a failure in production and require a rollback or hotfix.
A lower failure rate points to a more stable system and a more reliable development process. High failure rates can signal rushed work, brittle infrastructure, or poor test coverage.
Failed deployment recovery time
The time it takes to recover from a failed deployment. This measures a team’s resilience and ability to detect, respond to, and resolve incidents quickly. Fast recovery times help reduce customer impact and support continuous delivery.
These four metrics give CTOs a common language for discussing delivery health with teams, executives, and the board. But—crucially—they must be read together. A high deployment frequency means little if paired with a high failure rate. A fast lead time is dangerous without fast recovery.
Used correctly, these metrics help CTOs:
- Spot delivery bottlenecks and systemic fragility
- Compare teams fairly based on throughput and stability
- Build trust with business leaders by showing progress in operational terms
The magic isn’t in the metrics themselves. It’s in how you interpret them—and what actions you take next.
Flow: A true signal of developer effectiveness
Flow measures how much focus a developer can maintain during their work. Think deep work, not just busywork.
DORA found that a 25% increase in AI adoption correlates with a 2.6% increase in flow. Developers are spending less time on repetitive tasks and more time in the zone.
Why it matters:
Flow is the hidden engine of creativity and progress. When teams can enter and sustain flow states, they build better systems with fewer errors and less burnout.
Strategic takeaway for CTOs:
- Use developer surveys and interviews to regularly measure perceived flow—and just as importantly, its inverse: cognitive load.
- Cut unnecessary process overhead. Every time an engineer has to pause work to update a ticket, respond in Slack, attend a meeting, or wait for approval, their mental context is shattered.
- Invest in tools and platforms that reduce repetitive work.
The finding is: flow isn’t just a feel-good productivity stat. It’s a force multiplier that affects code quality, delivery speed, and even team morale. When developers can spend more time in flow, the organization as a whole moves faster, with less friction.
Organizational performance: Where the boardroom cares
According to DORA’s findings, If AI adoption increases by 25%, this adoption is positively associated with a 2.3% increase in organizational performance, which includes profitability, market share, customer satisfaction, operating efficiency, and ability to meet goals.
Why it matters: Organizational performance is the most board-facing metric in DORA. It's a composite that connects technical decisions to bottom-line outcomes.
Strategic takeaway for CTOs:
- Justify large-scale initiatives (AI adoption, platform engineering, DevOps transformation).
- Show how developer experience translates to strategic advantage.
- Build the bridge between engineering performance and business KPIs.
Product performance: A lagging indicator
Despite improvements in productivity and team performance, AI adoption only increased product performance by 0.2%. Usability, availability, latency, and security didn’t move significantly.
Key takeaway for CTOs: AI and developer tooling might make internal work easier, but that doesn’t guarantee a better product. Product quality still hinges on tight user feedback loops, domain expertise, and thoughtful UX, not just faster code shipping.
Use it to:
- Emphasize the importance of user-centricity, which DORA also confirms as crucial for high performance.
- Reinforce that product metrics must remain grounded in customer impact, not just development throughput.
- Balance investment between engineering velocity and product research/design.
Productivity: Scaling through individual efficiency
A 25% increase in AI adoption leads to a 2.1% increase in individual productivity, driven by reduced context switching and more personalized support (e.g., AI summarizing code or generating documentation).
Strategic takeaway for CTOs: More productivity doesn't mean more hours or story points. It means value delivered per unit of cognitive effort. CTOs must be careful not to equate productivity with busyness.
Use it to:
- Justify productivity tool investments (e.g., AI pair programming, smart search, knowledge sharing).
- Track productivity with developer surveys, not just Jira burnups.
- Educate execs on why quality documentation and cognitive load management matter.
Team performance: The invisible engine
AI adoption increases team performance by 1.4%, defined as the team’s ability to collaborate, adapt, and rely on each other. This is where most delivery outcomes originate.
Strategic takeaway for CTOs: Team performance is often a leading indicator of success. It’s harder to quantify, but easier to observe in high-functioning teams: shared ownership, psychological safety, and smooth cross-functional collaboration.
Use it to:
- Guide org design (e.g., team autonomy, reduced handoffs).
- Make the case for investing in leadership training or reducing the management span of control.
- Complement delivery metrics like lead time with qualitative assessments.
Was this article helpful?
Verified author
We work exclusively with top-tier professionals.
Our writers and reviewers are carefully vetted industry experts from the Proxify network who ensure every piece of content is precise, relevant, and rooted in deep expertise.

Stefanija Tenekedjieva Haans
Content Lead
Journalist turned content writer. Always loved to write, and found the perfect job in content. A self-proclaimed film connoisseur, cook and nerd in disguise.
Related articles
 Feb 25, 2026
•
Stefanija Tenekedjieva Haans, Petar Stojanovski
•
12 min readAI governance for engineering teams: policy templates, risk levels, approval flows
 Feb 25, 2026
•
Stefanija Tenekedjieva Haans
•
10 min readAI governance that actually works: A practical guide for engineering teams
 Jan 26, 2026
•
Stefanija Tenekedjieva Haans
•
9 min readBuilders in review: The best takeaways from 2025 on our podcast
Find your next developer within days, not months
In a short 25-minute call, we would like to:
- Understand your development needs
- Explain our process to match you with qualified, vetted developers from our network
- You are presented the right candidates 2 days in average after we talk