NEW
Proxify is bringing transparency to tech team performance based on research conducted at Stanford. An industry first, built for engineering leaders.
Learn more
Insights
Dec 22, 2025 · 18 min read
What Stanford’s study of 100,000 developers reveals about AI’s real impact on engineering productivity
Output is the new currency of engineering management, and the data looks different from the hype.
Vivek Yadav
Creative Copywriter
Verified author

Table of Contents
- The limits of the metrics everyone uses
- From expert judgment to a model you can run at scale
- What the data really says about AI and productivity
- A closer look at one AI pilot
- The AI investment cycle and the emerging productivity divide
- What top-quartile teams are doing differently
- Managing for output, not headcount
- The next decade of engineering leadership
- Find a developer
Most technology leaders can see what their engineers are doing. Tickets move. Commits land. Pull requests open and close. People attend standups and write retrospectives. Managers and tech leads have opinions about who is strong and where work is getting stuck.
What is much harder to see is how much meaningful, durable output the organization is getting for that effort.
That blind spot was tolerable when software moved more slowly, and AI was a novelty. It is not tolerable anymore. Finance reconciles every cent. Sales live inside the pipeline and conversion metrics. Marketing experiments with controlled cohorts. Engineering, in many companies, still operates with a fogged dashboard and a handful of activity metrics.
“When companies hire engineering talent, they can see who is online, who is committing code, and how responsive people are — but they cannot easily see whether the work is genuinely good or whether the team is compounding value over time."
Viktor Jarnheimer, CEO at Proxify
Over the past few years, researchers at Stanford and P10Y have worked directly on that problem. By analyzing the work of more than 100,000 contributors across hundreds of companies, they have shown that it is possible to approximate what a panel of expert engineers would say about each change to a codebase: how complex it is, how much effort it likely took, and how maintainable it is.
Throughout this article, we draw on that work as the lens for thinking about productivity: first to show why familiar metrics break down, then to explain how expert-grounded output measurement works in practice, and finally to examine what AI is actually doing to real engineering teams.
The result is a quantified view of engineering output grounded in expert judgment rather than lines of code or pull request counts. For organizations that adopt this lens, productivity starts to look less like a black box and more like a number that can be tracked, trended, and improved.
The limits of the metrics everyone uses
Most organizations did not design their engineering metrics from first principles. They adopted what their tools exposed by default and what could be collected without much friction: commits, pull requests, DORA metrics, velocity, and occasional surveys. Each of these captures a slice of reality. None of them was built to answer the question that matters now: how much meaningful, maintainable work is being done.
Commits and pull requests are attractive because they are easy to count and trend. They are also blind to task size and quality. A one-line fix for a production incident and a week of deep architectural work can both show up as a single pull request. Teams that structure their work into smaller, reviewable changes inflate those counts without increasing real output.
AI amplifies that distortion. Coding assistants are particularly good at generating many small, mechanical edits. It becomes easy for a team to appear busier on every activity metric while quietly adding more code that someone else has to stabilize and maintain.
DORA metrics tell a different story and have their own limitations. Deployment frequency, lead time, change failure rate, and time to recover are crucial indicators of DevOps and CI/CD performance.
They show how smoothly changes move from commit to production. They do not say whether those changes are trivial or substantial, whether they are paying down technical debt or quietly adding to it. In practice, DORA measures the health of the pipeline, not the value of what flows through it.
Velocity and story points sit in the same category. They are useful for planning within a team. They are not comparable across teams and can be inflated without delivering extra customer value.
When these signals feel inadequate, leadership often turns to surveys. Developers are asked whether AI tools make them more productive and whether they feel faster or more effective.
In one experiment, 16 developers completed 246 tasks, some with AI and some without. Asked afterward, they reported feeling around 20 percent more productive when using AI. Measured task completion time showed the opposite: with AI, they were around 20 percent slower.
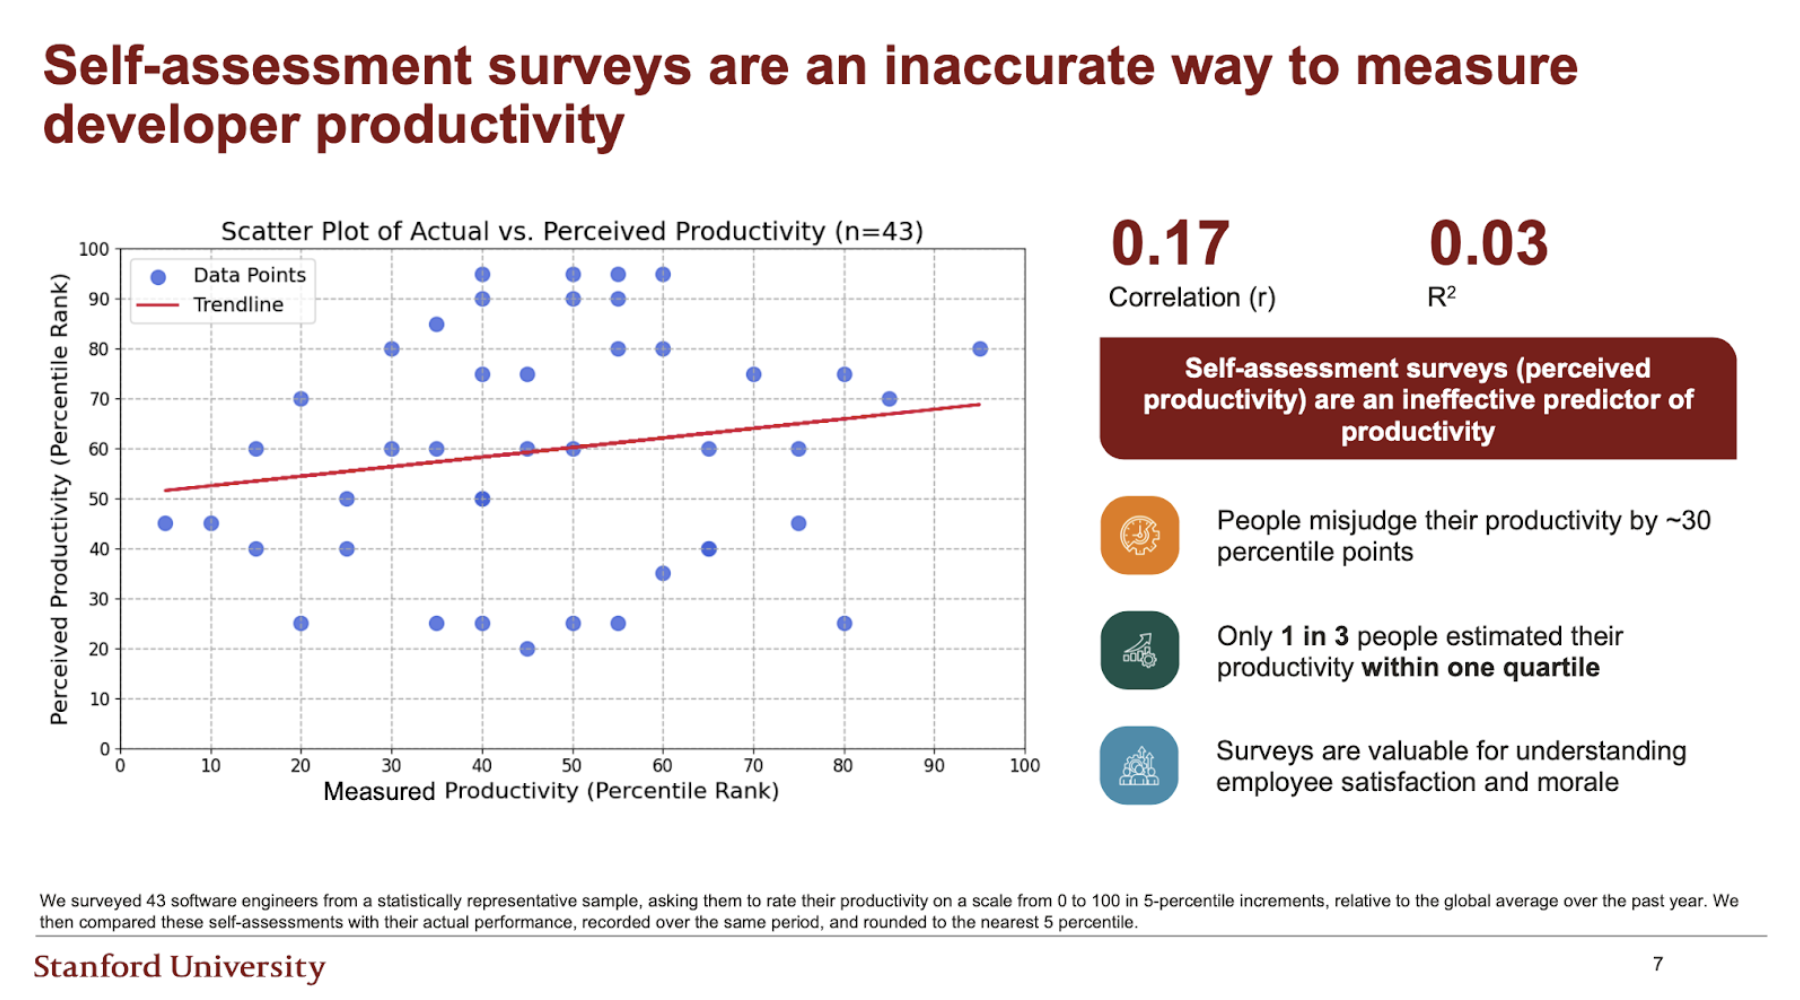
In another study, 43 developers rated their own productivity relative to a global median on a scale from 0 to 100. Only about one in three placed themselves within one quartile of their measured performance. Surveys are valuable for understanding sentiment and adoption. They are a weak instrument for measuring output.
Yegor Denisov-Blanch, a Software Engineering Productivity Researcher at Stanford, summarizes the situation this way: companies are starting to experiment with AI at scale, but they cannot reliably measure whether it is working. The current metrics are not sufficient.
The pattern is consistent. These metrics are easy to collect and display on dashboards. They correlate only loosely with the underlying performance leaders actually care about: the volume and quality of meaningful changes that reach production and stand up over time.
Boost your team
Proxify developers are a powerful extension of your team, consistently delivering expert solutions. With a proven track record across 500+ industries, our specialists integrate seamlessly into your projects, helping you fast-track your roadmap and drive lasting success.
From expert judgment to a model you can run at scale
If the usual numbers do not tell us much about output, the obvious question is what would tell us that.
If you ask a seasoned engineer what they look for during a review, their answer rarely mentions raw counts. They talk about the complexity of the problem, the likely implementation effort, the clarity of the design, how well the change fits existing architecture, and how maintainable the result looks over the long term.
The Stanford and P10Y work starts from that reality. In controlled studies, panels of 10 to 15 senior engineers reviewed code changes in context and rated each one on dimensions such as estimated implementation time, problem complexity, and maintainability. The panels showed strong internal agreement, and in sandboxed experiments, their estimates tracked actual completion time and effort. That gave the research team a principled definition of output that matches how experts already think about it. It did not solve the scale problem. No organization can afford a permanent panel of engineers reading every commit.
The next step was to make that panel teach a model.
Using the rated examples as training data, the team trained a machine learning model that takes the same inputs as the experts and learns to produce the same outputs. Once trained, the model is plugged directly into Git. For every commit, it analyzes the diff and the surrounding repository context, then combines this with metadata such as author, timestamp, and repository.
For each change, it generates at least three signals:
-
A quantified measure of output, sometimes referred to as output units
-
A quality or maintainability score
-
A classification of the work: net new functionality added, functionality removed, refactoring, or rework
Rework has a specific operational definition. If code is changed again within three weeks of its introduction, that change is treated as rework rather than as fresh output. The assumption is simple: if something needs to be revisited that quickly, the original change was incomplete or fragile. Effort spent there is effort spent fixing recent work, not advancing the product.
When people in this context talk about effective output, they mean output units after rework has been discounted and quality has been taken into account.
The chain from research to deployment looks like this:
-
Validate that a panel of experts can reliably rate effort, complexity, and maintainability.
-
Train a model to mimic those ratings on new code changes.
-
Run that model across more than 100,000 contributors and hundreds of organizations by integrating with Git.
Aggregated over time, these readings give a picture of output and quality at different levels. You can look from individual engineers and squads through product areas up to the organization as a whole. You can see how much net new functionality is being added, how much effort goes into refactoring, and how much is consumed by rework. You can watch maintainability scores rise or fall month over month.
A crucial property of this approach is that it is code-aware and neutral with respect to tooling. The model evaluates the resulting code. It does not inherently care whether a human, a coding assistant, or an agent wrote the first draft. If AI helps a team ship better-structured, more maintainable changes faster, measured output rises. If AI encourages large, brittle changes that quickly generate rework, output stagnates or falls once that rework is counted.
The measurements are not perfect, but they behave more like a financial or operational metric than the crude proxies the industry has relied on so far.
What the data really says about AI and productivity
Once output is measured in this way, AI’s effect on productivity looks more nuanced than either the hype or the backlash suggests.
A first useful split is between greenfield and brownfield work, and between low and high complexity tasks.
-
Greenfield here means new projects or modules being built more or less from scratch.
-
Brownfield means changes made inside existing codebases with established dependencies and constraints.
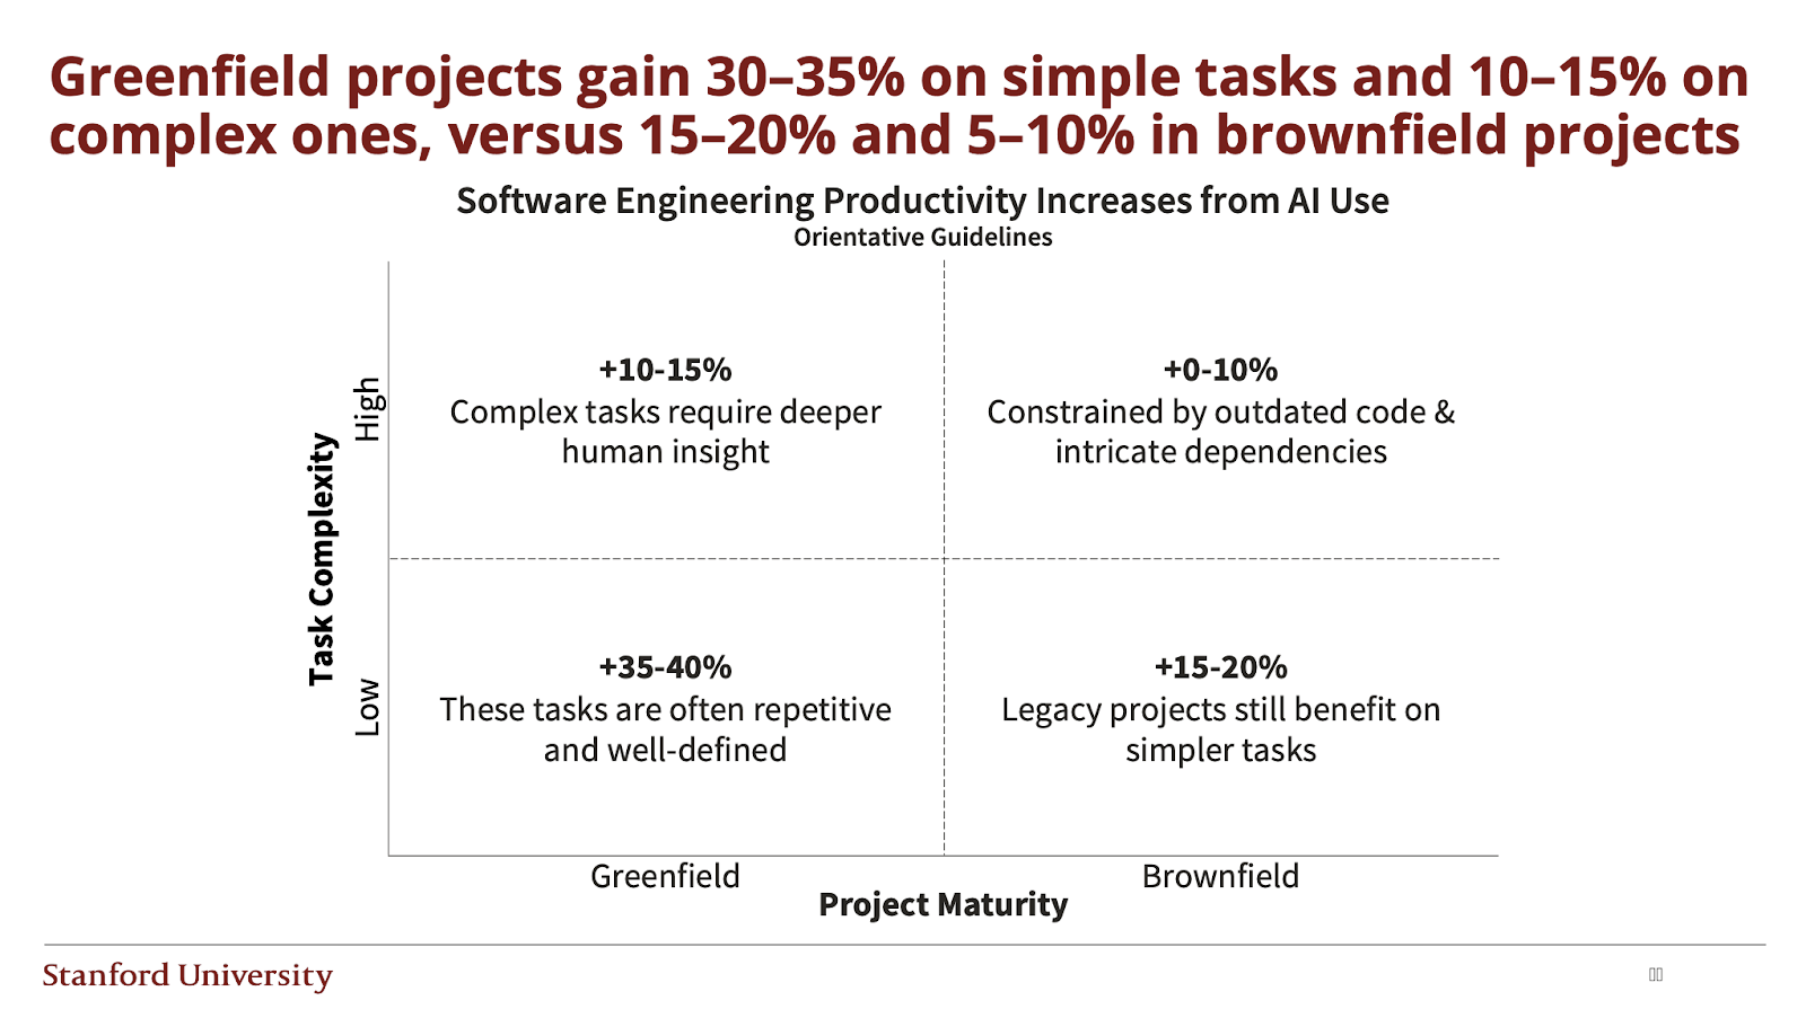
Low-complexity greenfield tasks are where AI shines. On small, well-bounded problems in new code, coding assistance often increases measured output by around 30 to 35 percent. For high-complexity greenfield work, the gains are real but smaller, typically in the 10 to 15 percent range.
Most practical work, however, takes place in brownfield environments. Large, evolving codebases with legacy decisions, domain constraints, and integration points that are not fully trusted are the normal case. In that setting, the numbers flatten.
For low-complexity brownfield tasks, AI still offers a modest uplift of around 15 to 20 percent. For high-complexity brownfield work, the median improvement drops into the single digits, closer to 5 to 10 percent. A material share of teams actually see a net decrease in productivity when they apply AI to that kind of work, because the extra rework and debugging time cancels out the apparent speedup.
Language ecosystem has a visible impact as well. When you break results down by language popularity and task complexity, popular languages such as Python or Java, with rich public training corpora, show around 10 to 20 percent gains from AI, depending on task complexity.
Low-popularity languages such as Clojure, Haskell, or Elixir, particularly on high-complexity tasks, often see little benefit or even a negative impact. The models have less high-quality training data to work from, and more of their suggestions require correction.
Context length is another constraint. The data shows that many large language models lose about half of their performance by the time they reach around 32,000 tokens of context, even when they advertise much larger maximum windows. In practice, a single nontrivial agent query in a real codebase can easily involve tens of thousands of tokens when you include relevant files, tests, and documentation. The larger and more entangled the system, the harder it is for an AI model to keep enough high-quality signal in scope.
When you zoom out to teams, a realistic baseline emerges. In an observational study of 46 closely matched teams, about half of which were using AI, the AI-assisted teams achieved around a 10 percent median productivity gain when measured with the expert-trained metric. More interesting was what happened at the extremes.
Over time, the gap between the top quartile and bottom quartile AI teams widened to nearly four times its initial size as the best adopters compounded their advantage and the weakest ones stalled or went backwards.
This is neither a story of AI replacing mid-level engineers nor a story of AI as a novelty. It is a lever whose impact depends heavily on where and how it is applied.
A closer look at one AI pilot
One large case study illustrates this clearly. A company with several thousand engineers introduced AI coding tools into a subset of around 350 under one vice president. They wanted to see what happened to productivity.
On the surface, the result looked positive. Pull request counts rose by 14 percent in the post-AI period. Review throughput increased. Developers reported that they felt faster.
The output view told a different story. Across the same period:
-
Code quality, measured as maintainability, declined by 9 percent
-
Rework increased by a factor of 2.6
-
Effective output, after discounting rework, barely changed at all
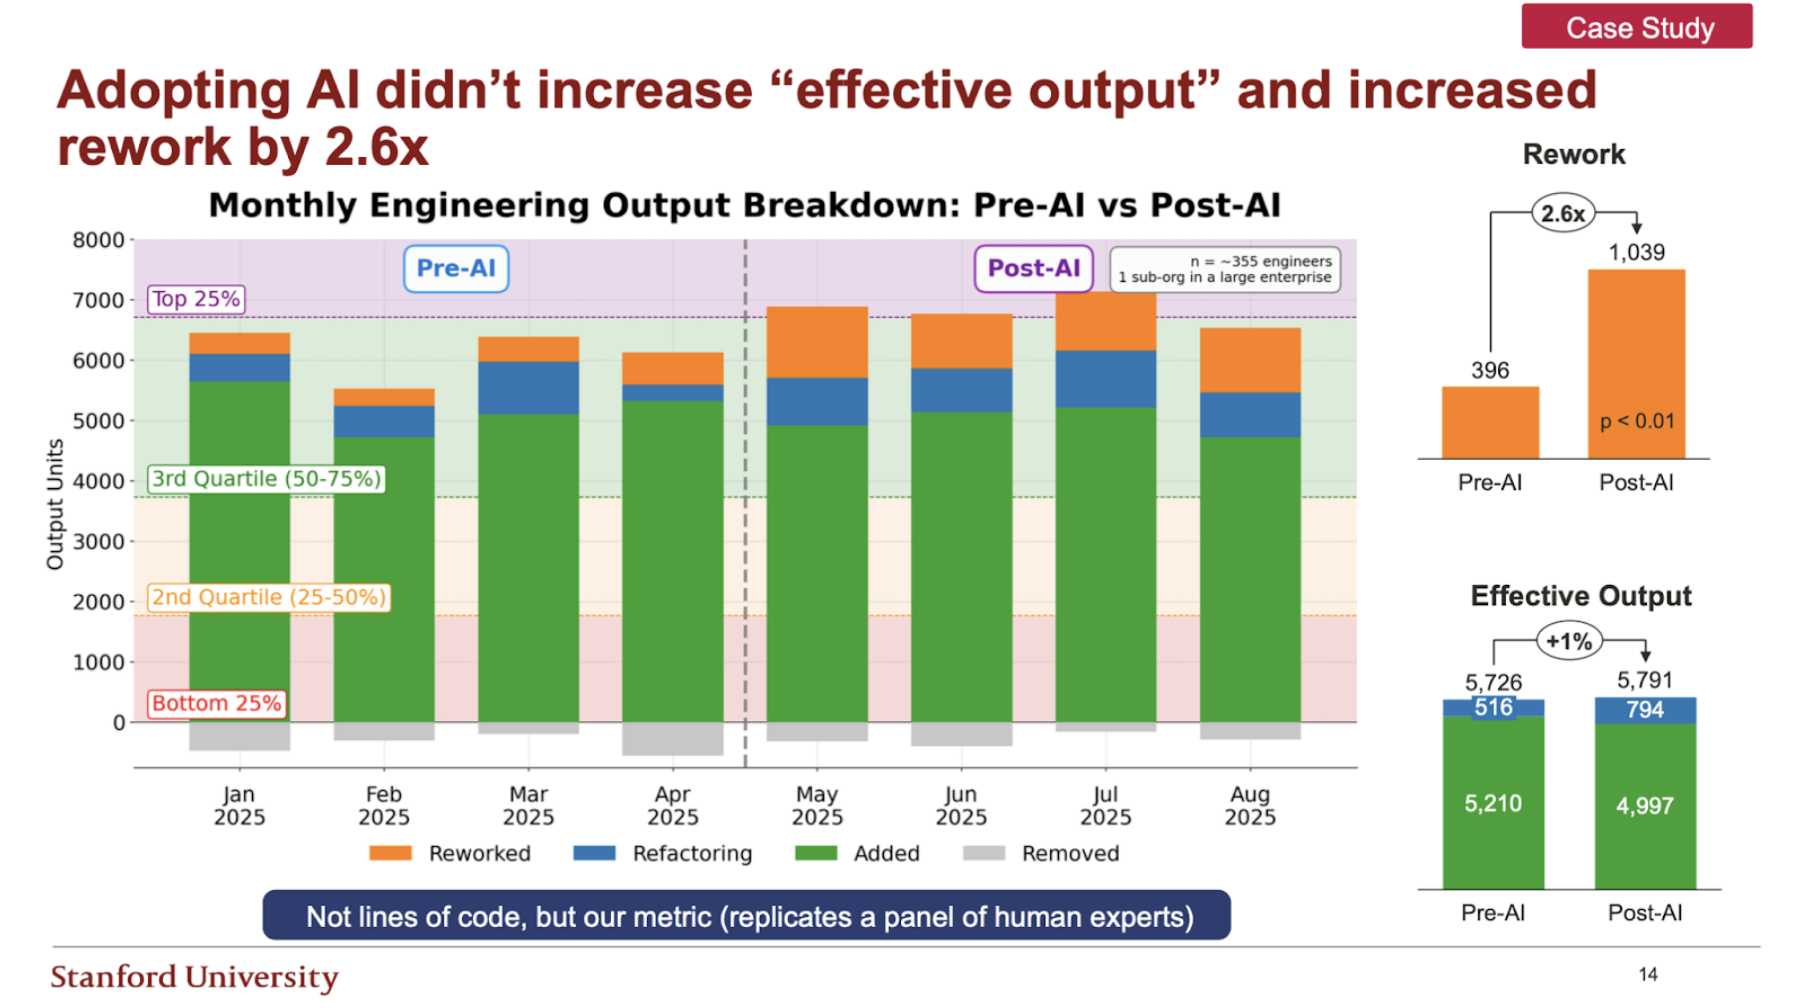
In effect, the organization used AI to generate more code, but much of it had to be fixed, so net progress was almost unchanged.
“Teams often feel faster with AI in the first couple of months, but in many cases they are creating technical debt that slows them down later."
Yegor Denisov-Blanch, Software Engineering Productivity Researcher, Stanford
Managing that pilot by PR counts and survey sentiment alone would make it tempting to declare victory. With an output-oriented metric in place, it is clear that the experiment created more noise than signal.
This is not a reason to avoid AI. It is a reason to instrument it properly.
The AI investment cycle and the emerging productivity divide
Across companies, a familiar pattern has played out.
Headlines and conference talks create a sense of urgency about adoption. Leaders feel pressure to invest in AI quickly or risk being left behind. They buy licenses, encourage experimentation, and hope that gains will materialize. At a macro level, surveys show high interest, but a recent MIT study suggests that around 95 percent of AI initiatives fail to produce a clear return on investment so far.
An output-based view adds another dimension. The same patterns that show up in team-level data repeat here: AI delivers a modest uplift on average, but results are highly uneven. Teams that learn how to use it well, pick the right use cases, and maintain discipline around quality see their output curves bend upward over time. Teams that overuse AI on complex brownfield work or treat it as a way to rush changes into production without guardrails often see their output flatten or decline.
Left unchecked, this is how an AI productivity divide opens up. It is not about who has access to the tools. It is about who has the measurement and operating discipline to turn those tools into a durable advantage.
What top-quartile teams are doing differently
Across the companies in this body of work, the teams that consistently appear in the top quartile share a few habits.
They use AI throughout the software development life cycle, not only as autocomplete in an editor. That includes help with specifications, tests, documentation, exploratory prototypes, and sometimes incident analysis. They treat coding assistance as one part of a broader workflow redesign, not as an optional add-on that a few individuals occasionally choose to use.
They break work into focused interactions rather than relying on long, monolithic agent runs. Engineers who get the most value from AI tend to orchestrate several smaller requests, each with a clear scope, rather than asking a single agent to redesign a large subsystem in one step. This keeps context within a range where models behave reliably and keeps humans firmly in control.
Most importantly, they measure. They treat AI rollouts as they would any other significant operational change. They define hypotheses, compare cohorts, and watch output, quality, and rework curves over months. They notice when a tool works well for boilerplate tests but poorly on core domain logic. They copy patterns from teams whose output is rising and intervene where output is falling.
By contrast, bottom-quartile teams often have access to the same tools but little instrumentation. AI usage is ad hoc. There is no clear link between how people feel about the tools and what the metrics say about output. Early experiments that go badly can undermine trust, leading to skepticism that is not revisited once better practices emerge.
For leaders, the message is straightforward. Licenses and internal roadshows on their own do not create productivity. Habits, guardrails, and feedback loops do.
Managing for output, not headcount
In an AI era, it is tempting to frame decisions around headcount. Cut a percentage of engineers and expect AI to make up the difference. Freeze hiring and ask teams to let the tools do more of the work. At the other extreme, saturate the organization with AI tools and assume that value will emerge on its own.
Output offers a better frame.
With an expert-grounded metric in place, different questions become possible:
-
How much net output are our teams producing, and how is quality trending over time?
-
Where is rework consuming capacity, and what is driving it?
-
Which teams are realizing gains from AI, and what can we learn from their practices?
-
Where is AI reducing effective output, and should we narrow its use or change the way it is applied?
Combined with business outcome metrics, this supports more mature conversations. One of the visualizations from this work plots engineering output on one axis and business outcomes on the other. A team can be highly productive while delivering the wrong outcomes, or it can pursue the right outcomes with a weak engine behind it. Sustainable advantage appears in the quadrant where strong engineering output and strong business outcomes reinforce each other. For Proxify’s clients, this shift is very concrete. As Viktor Jarnheimer describes it, the collaboration with P10Y gives them three practical benefits: transparent performance, so they can trust that their Proxify developers consistently deliver high output; full-team visibility, so they can see how the entire engineering team is performing; and the ability to take proactive action when the data shows emerging issues, rather than discovering problems months later. You cannot achieve sustainable advantage with activity dashboards and anecdotes alone.
The next decade of engineering leadership
These measurement techniques do not remove the need for judgment. They do not capture everything that matters in engineering work. They do, however, provide a sharper and more honest picture of what is happening inside an organization than the tools most teams rely on today.
For engineering leaders, clients, and prospective clients, a few principles are worth carrying forward:
-
Instrument output, quality, and rework at the level of commits and repositories before making big AI or headcount decisions.
-
Focus AI where the data shows clear benefit: lower-complexity work, greenfield projects, and mature language ecosystems, and monitor metrics closely when you apply it more widely.
-
Treat every AI rollout as a measured experiment with cohorts, clear guardrails, and explicit hypotheses, rather than a one-time tooling purchase.
-
Build a culture that expects uneven outcomes, learns from them, and propagates practices from top-performing teams into the rest of the organization.
Assumptions that felt safe six months ago already look dated. The only reliable way forward is to keep using AI, keep measuring its impact, and keep adjusting. The productivity black box is finally open, and the organizations that learn to manage for output and to judge AI through that lens will set the pace that others spend the next decade trying to match.
Was this article helpful?
Verified author
We work exclusively with top-tier professionals.
Our writers and reviewers are carefully vetted industry experts from the Proxify network who ensure every piece of content is precise, relevant, and rooted in deep expertise.

Vivek Yadav
Creative Copywriter
Find your next developer within days, not months
In a short 25-minute call, we would like to:
- Understand your development needs
- Explain our process to match you with qualified, vetted developers from our network
- You are presented the right candidates 2 days in average after we talk